Headlines
– limited impact on speeds – average speed remains under 27mph
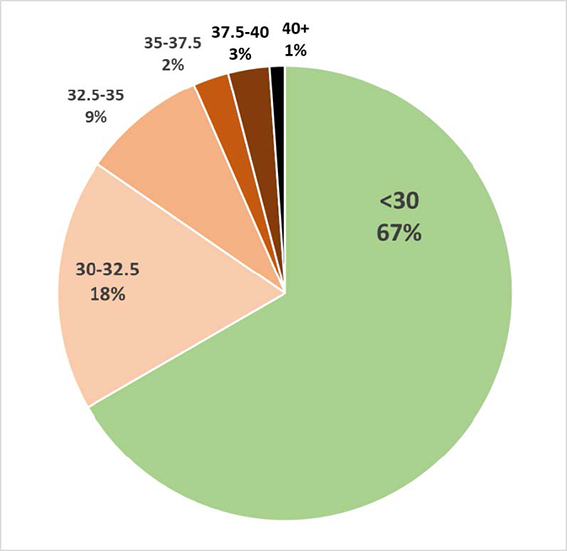
– 67% of drivers already within the speed limit
– sign clearly has a behavioural impact – 95% of drivers slow down, irrespective of initial speed
Background
In 2022 Sennen Parish Council sourced a Vehicle Activated Sign (VAS) in order to improve road safety and speed limit adherence in the village. The sign was deployed in May 2022 on the eastbound A30, just to the west of the village shop, approx coordinates 50.0736N, 5.6937W, with the first full day of operation being 12th May. Since then, an average of 1,200 vehicles per day have had their speed measured and displayed on the sign as they pass.
The sign logs a handful of data points for each vehicle:
- • Date & time
- • Entry speed – as the vehicle first enters the camera’s field of view
- • Exit speed – as the vehicle passes out of the camera’s field of view
- • Peak speed – the highest speed achieved within the field of view
- • Average speed – the average speed during the vehicle’s transit through the field of view
The sign logs all vehicles on a 24/7 basis, as a consequence of which the volume of traffic can also be analysed. Logs are downloaded from the sign and analysed using a bespoke piece of software provided by the supplier.
Analysis
The bundled software contains a standard report available only in PDF format. An example is attached. From this, the following conclusions can be drawn:
– The majority of vehicles pass the sign within the speed limit
– Traffic levels peak between 2pm and 4pm
– Average speed is higher overnight
The report can be run for individual months, custom periods, within which weekly / daily and weekday / weekend sections can also be extracted, at the cost of a potentially large and hard to navigate report.
The data can also be exported in a csv format which allows more universal software (Excel, Access, Power BI) to be used to interrogate the data.
Using that method enables some simple additional visuals to be produced for review purposes:
– The overall impact on speed is not significant, and in fact has increased since the end of the tourist season (note that the short scale amplifies the movements from month to month).

Using May as a baseline (slightly flawed as the sign was in place), the average speed was 26.8 mph. Across the seven subsequent months, the average speed has been 26.98 mph
– The vast majority of drivers are respecting the speed limits. Using the oft-quoted margin of error for enforcement cameras of “10% + 2mph”, the chart shows that 94% of traffic would not be subject to enforcement action.
– Drivers slow down when they pass the sign, to varying degrees

The overall average speed reduction is 9.4%, rising to 10.2% when vehicles speeding up are factored out.
– Of those who are initially travelling above 30, over half are travelling below 30 as they pass the sign, although this too has drifted alarmingly in November and December. The minor positive here is that attempts to brake are increasing alongside speed.

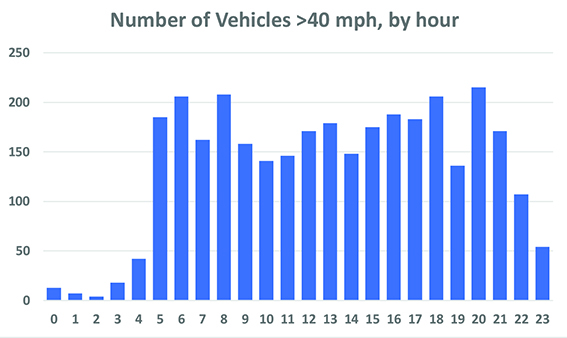
– While the average speeds are highest when pedestrian / other traffic levels are lower, an extreme example can occur at any time.

Traffic types
Given the rural nature of the community, a number of vehicles passing the sign will be particularly slow moving – agricultural vehicles particularly, and potentially bicycles. The slow speeds of these vehicles will be having an impact on the overall average speeds seen. However, the data only includes 6,400 vehicles travelling below 20 mph, from a total of 290,000, and therefore the impact is small enough that it can be ignored.
Download the report here:


